Are Home Prices Going Up?
Can I sell my home more now than last year?
Is it a good time to buy?
You may be wrestling with whether to buy, sell, or wait. If that sounds about right these are pretty crucial questions to have answered, because having the best information tends to lead to better decision-making.
We wrote last year about 8 signs of recovery to look for, and those signs are now ubiquitous (confidence has returned, as well as jobs, etc). Then, on January 1st this year we took a peek into the 2018 real estate market.
Both pieces hinted at a more balanced future, and the market has indeed very much found balance since those blogs were published.
In today’s post, I’ll catch you up on what’s been going on with the Fort McMurray real estate market in the meantime, and I’ll attempt to answer those huge questions. This way, whether you are thinking of buying, selling or sitting on the couch, you’ll have some good info to factor into your decision making.
Prices Finally Low Enough
It’s my opinion, from looking at the data, that at some point late last year, aggregate prices reached a point which triggered behavioural changes in a large number of actors in the marketplace (sellers & buyers): In the fall, sellers began
listing their homes at a slower pace than of late, and towards the very end of the year,
demand picked up somewhat.
To see what I mean, let’s compare the monthly rate of new listings Sep-April for 2015/16 vs the same period 2017/18 in the following chart:
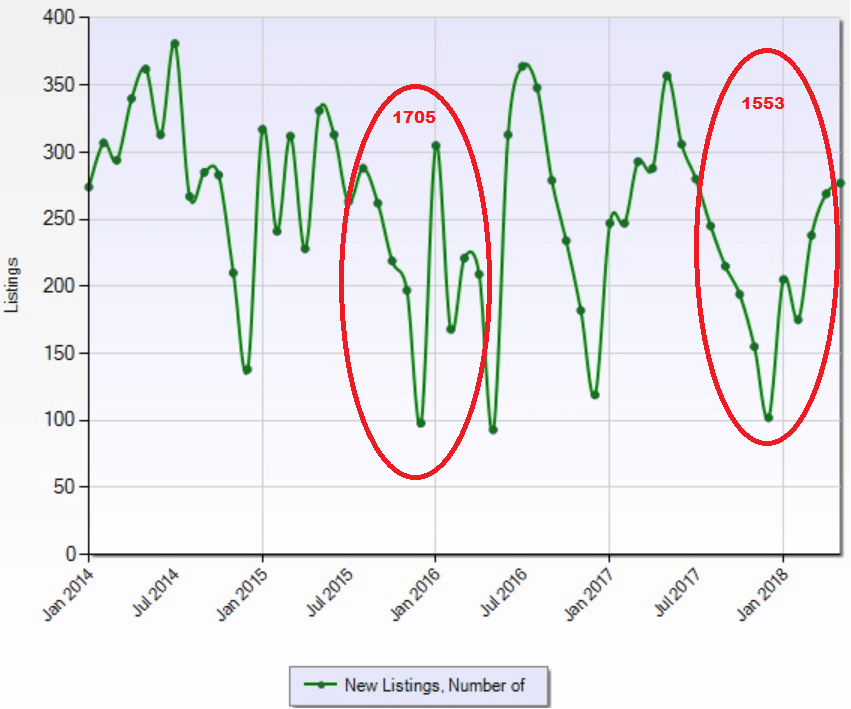 Chart 1: New Listings (Monthly) Over Time
As you can see, the rate of new listings was down approximately 10% since in the September 2017 to April 2018 period compared to September 2015 to April 2016.
Similarly, we can check out sales activity over the same periods:
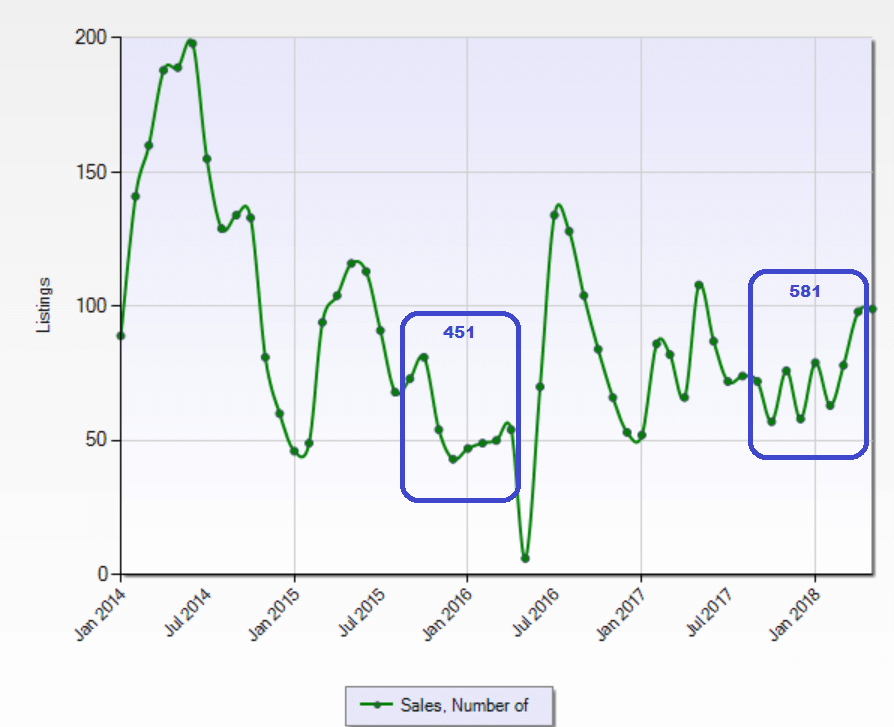 Chart 2: Sales (Monthly) Over Time
Albeit from a very low base, the number of transactions in the period September 2017 to April 2018 has increased by approximately 29% versus the period September 2015 to April 2016
A Balancing Act
The Fort McMurray
housing market is generally in balance.
Let’s recap:
- In Q4 of last year, the market reacted to lower prices
- In Q1 of this year, we entered what’s called a balanced market.
We can actually go a little further:
3) Today, there are just the right amount of sellers and buyers in the marketplace to support current prices.
4) Generally speaking, sale prices are no longer falling.
I'll explain...
3) Just the right amount of sellers and buyers: Today we have 521 listings on the market. In the last 30 days, we have seen 93 sales. This gives us 521/93 = 5.6 months of inventory. This right around the magic number for a balanced market. Another ratio we look at is the new listings to sales ratio. In May, there were 198 new listings and 108 sales. This is approximately a 2:1 ratio. Guess what? That’s also a balanced market indicator!
4) Generally speaking, sale prices are no longer falling. In a small market like ours hard to identify the moment that prices stopped falling (because one or two outliers can affect the statistics), but we more-or-less know that that moment is in the past. For example, we haven’t been pricing in decreases in value over time into our new listings, and they’ve been selling well. In some cases, our specialist listing agents have recently sold homes for prices above what we would have anticipated back in the winter months. Please beware though, before drawing any conclusions about the value of your own home: We’re just talking in general terms, and as you will see in the next section, it’s a much more complex picture than (prices are no longer falling).
So...Are Prices Going Up?
In a word, “no”.
But it’s complicated.
Let’s have a look at the following table:
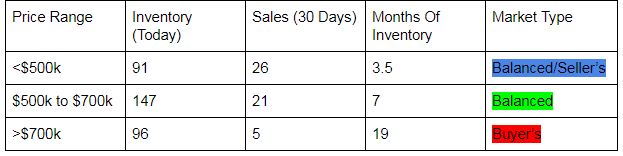 Table 1: Months Of Inventory (Absorption Rate) Calculations for Different Price Ranges (Market for Permanent Homes Without Condo Fees)
If you were reading carefully earlier, you’ll know that the magic number for a balanced market is about 5.5 months of inventory. What we can glean from the table above, is that the market for expensive homes is in a totally different place to the market for entry-level homes!
We can talk all day about how the market is, in general, balanced, but it doesn’t mean much until you drill down into the different parts of the market. For example, the same thing is happening in the markets for condos and mobiles: The market is fairly active (and in some areas low on inventory), but once you get up past certain price points, things quite suddenly get a lot trickier for sellers and easier for buyers.
“Why is this?” I hear you ask.
Well, I think there are at least two things at play here that are negatively impacting demand in the higher price ranges. Firstly, while I did mention earlier that confidence has returned, I think it has done so in a limited way. Everyone and their dog seems to be willing to buy a home for under $500k, but ask them to shell out $900k on a luxury home and they’ll go back to asking questions about the economy and future. Secondly, it seems that though the oil market is now clearly entering a growth cycle, mortgage rules and interest rates have significantly reduced (in a fairly permanent way?) people's’ buying power.
Another word of caution, is that this table is based on just a month’s data, and sales and inventory are like shifting sands.
Conclusion
Over the last year we have witnessed a lot of change in our marketplace. Inventory is down, sales are up, and prices are relatively stable for many housing types/price ranges.
Sections of the market remain oversupplied, while others (for example lots), are moving much quicker now than they have in four years.
We get asked often about whether prices are rising, and also whether we think they will. Our answers to those two questions are “it’s generally a balanced market” and “we can’t predict the future, but it's generally a balanced market right now”, respectively.
There are probably some limited parts of the market (e.g. entry-level single-family homes), where we might recommend a higher list price today than we would have, say 3-6 months ago, but these are the exceptions, not the norm.
Is it is a good time to buy a home in Fort McMurray? Well as always, that’s really personal to YOU. But in general terms, my answer is that it likely isn’t a bad time to buy. It certainly isn't compared to the past.
For anyone pondering the future, I’ll leave with a few themes - just some things to point out…
- Towns/cities across the province are split between balanced markets and buyer’s markets (prices falling)
- Provinces across the country are mainly split between balanced markets and buyer’s markets (prices falling)
- The oil market is no longer oversupplied but global investors have not returned to the oil sands. Two pipelines are getting built.
- We were surprised that so few rebuilt homes were listed for sale, but there are a vast number of condos about to be finished. The fraction of which will be listed for sale is...well...unknown.
THANK YOU for reading/following. If you enjoyed this article, please consider sharing it with friends: I really hope this helps you and them out!