Introduction: What Has Gone On?
“Crash” is a very emotive word.
In our profession (REALTORS®), we use the word “correction” which is a more scientific descriptor of our local real estate market since 2014.
“Fort McMurray Real Estate Forecast” is NOT the title of this post. I won’t attempt to predict the future of the market; in this post I will bring you up to speed as to what has gone on thus far during the correction.
I will try to shed some light on what has gone on so readers can better understand the local real estate market.
Here is a graph of prices over time:
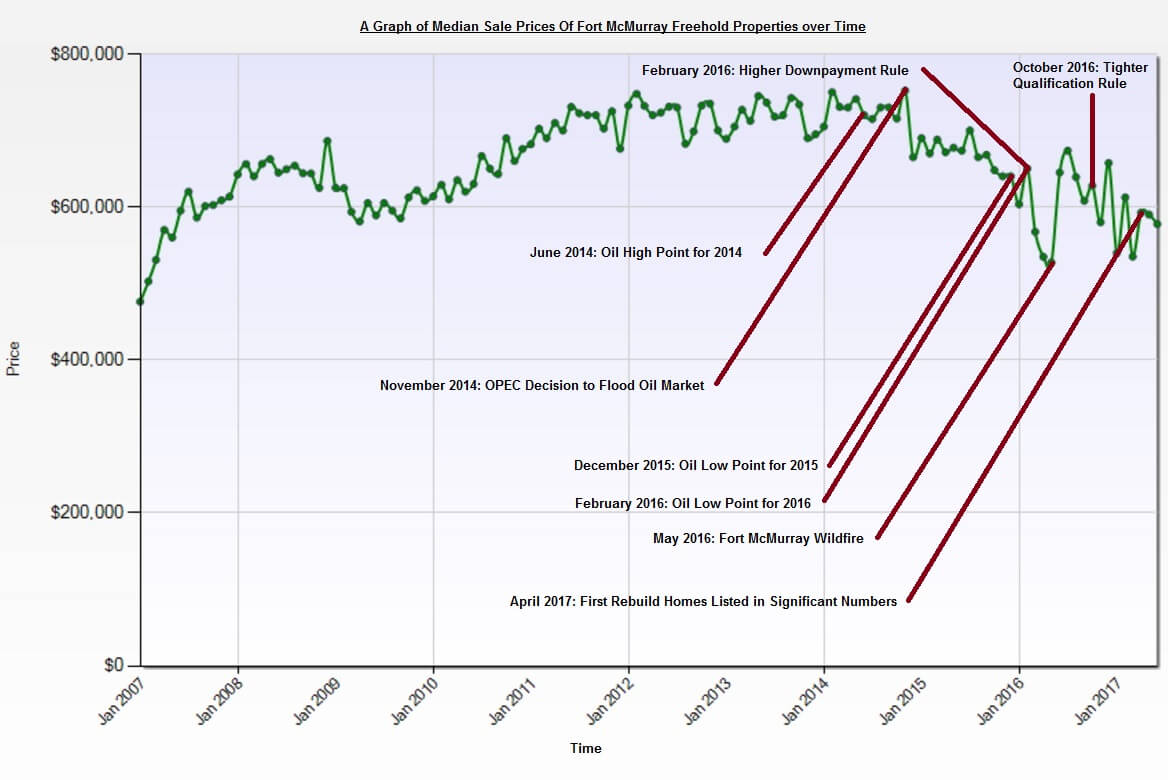
This graph represents the median sale price, each month, of (mainly) single-family homes and duplexes (without condo fees) in urban Fort McMurray over the last 10 years. See the crazy footnote “2” for more details.
Three Broad Categories of Causes
In my mind and experience, there are three main groups of causes which may have had effects on supply and/or demand, and therefore prices.
Oil: Fort McMurray’s economy is resource-based: We live in an oil town, and the income of families is determined by the oil price through the mechanisms of employment income, benefits and the level of employment.
Wildfire: Our town has been deeply affected by the desperately sad 2016 wildfire.
Government & Monetary Policy: Thirdly, the Government of Canada and Bank of Canada have taken a hawkish approach on the housing market over the time period 2014-2017 which has impacted family budgets and expectations.
Events That Might Have Impacted The Housing Market
Let’s look at the events which might have impacted supply and/or demand for Fort McMurray homes during the correction to date.
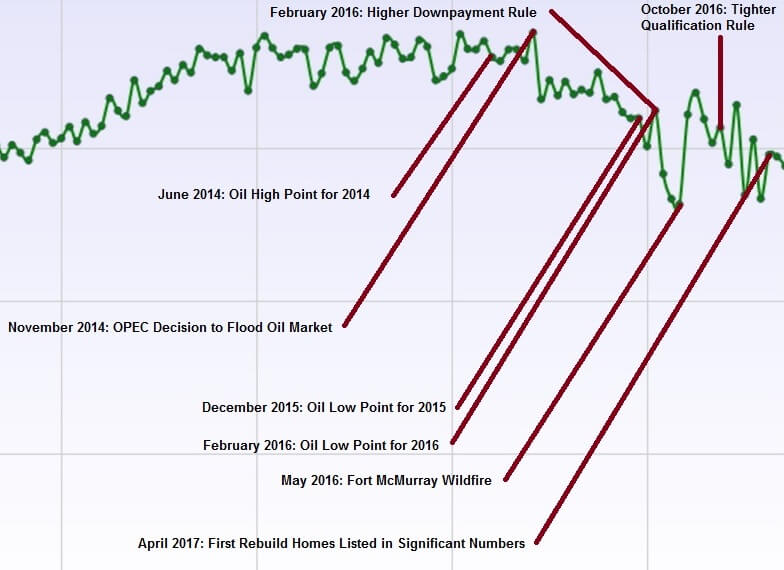
For readability, here is a zoomed-in version of the above graph:
1) June 2014: Oil High Point for 2014
At the start of the period of study, we have oil (WTI) at $107.95 on
June 20th, 2014. What was Fort McMurray like at the time? Full employment, high and stable wages, the majority of land owned by a handful of organizations, high rates of capital flow into the region, large infrastructure projects nearing completion and an investment-friendly political climate.
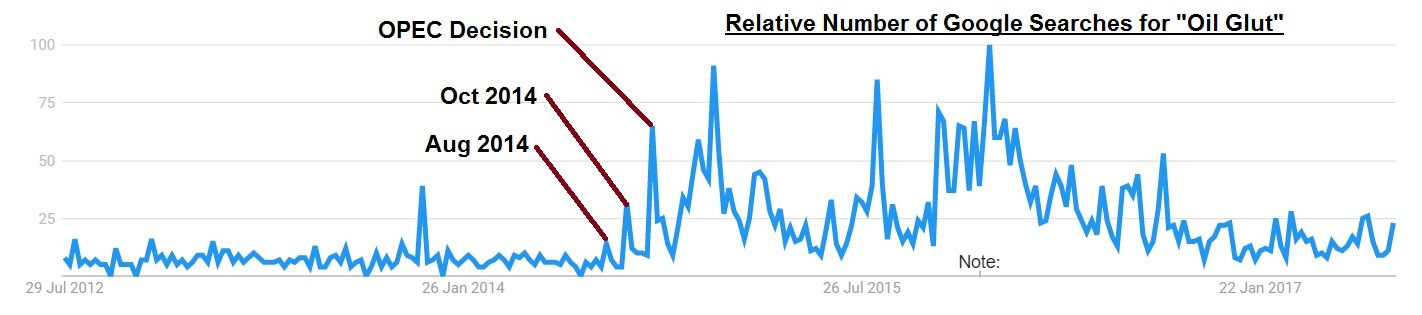
On the side of negative outlook, there were pipeline bottlenecks, and a booming US shale industry which was (without the world really noticing) just starting to cause a glut of supply. You can see from the following Google Trends graph that few people were aware of the growing glut until after the OPEC decision:
2) November 2014: OPEC Decision To Flood Oil Market
On
November 27th, 2014, Saudi Arabia stopped OPEC from cutting production to prevent a glut of oil. The policy change meant that the Kingdom of Saudi Arabia and the US shale oil producers would enter a game of chicken. Who would blink first? Would Saudi Arabia change back because of political unrest or rapidly emptying government coffers, or would US shale companies limit production (or go bankrupt) due to flagging prices?
In the end, the US shale producers would win out, but in the meantime, a vast global oil glut grew, causing prices to crash. Since then, they have largely been range bound ($40 to $60 per barrel) until the time of writing.
In Fort McMurray, demand for homes fell immediately by approximately 50% after the policy change due to hiring freezes and layoffs which resulted in the disappearance of confidence. The local (incorrect) consensus was that the oil market would correct itself within months. As a result, the public did not rush to list their homes for sale. When the rate of families listing their homes did tick up, it was compensated for by the virtual ceasing of all new construction. The price correction was caused by a lack of demand, not an oversupply. Therefore, prices fell steadily during 2015 by approximately 0.8% a month.
3) Winter 2015/2016: Low Point For Oil
WTI fell to $26.19 on February 11th, 2017. As a result, rather than seeing a return to investment, oil producers cut budgets (and workforces) further and shelved projects. Capital took flight from the oil sands. This period was dominated by political uncertainty surrounding industry taxation, government spending and pipeline politics.
During the period January to April 2016, Fort McMurray home prices suffered their greatest losses of the correction (approximately 2% a month). As in 2015, this was not due to an oversupply of homes on the market. Instead, it was due to anaemic demand. During these months, the number of homes changing hands was down 50%-70% vis-a-vis the same months two years previous.
4) February 2016: Higher Down Payment Rule
On
February 15th, 2016, the Government of Canada increased the required down payment for most home-buyers of homes between $500,000 and $1,000,000. This was implemented to reduce demand in the overheating markets of Vancouver and Toronto. Like those cities, the Fort McMurray housing market was characterized by high prices
. That made Fort McMurray collateral damage.
It’s only anecdotal evidence, but in my experience as a REALTOR® 2012-2014, the majority of my clients had purchased their homes with 5% down. Buyers such as these would now need to defer their purchases until they could save the new, higher minimum down payment to buy the benchmark Fort McMurray home. Some saved, some lowered their budgets and others presumably decided not to buy at all. This added to the demand problem.
5) May 2016: Fort McMurray Wildfire
Aside from the agonizing human impact that the fire had on families, it has also had an effect on the housing market. 2,600 homes were destroyed and an estimated 5,000 community members ultimately decided not to return. It is also resulting in a construction boom.
Fort McMurray fire anniversary comes as some still struggling to rebuild
When the fire swept into the area last May, more than 80,000 people evacuated, and includes those who were living and working at oilsands camps outside of the city. Officials with the Regional Municipality of Wood Buffalo estimate that around 5,000 Fort McMurray residents have not returned since the fire, but it is difficult to get an exact figure. The city's population has always fluctuated with the booms and busts of the resource economy and before the fire hit, the region was already struggling through a downturn.
Now that downturn is expected to be eased, at least somewhat, by a post-fire construction boom. The Conference Board of Canada estimates that over the next three years, $5.3 billion will invested in rebuilding. Via cbc.ca
In June, July and August of 2016, inventory fell and remained lower than the
10-year average due to homes being lost or temporarily delisted. At the same time, demand ran high as people bought homes to replace those they had lost. It was a brief seller’s market and prices rose. In the following few months, supply and demand returned to their previous mean. That is, there was a return to a buyer’s market due to the underlying economic malaise in the oil industry. It’s possible that the full extent of the fire may not have yet been realized: The rebuild continues (housing is becoming available), but the inflow of families has narrowed from a flood in 2016 to a trickle in 2017.
The fire has also caused the market for vacant lots to become more competitive which tends to bring down lot prices as sellers and groups of sellers (e.g. developers) lose some of their price-setting power.
6) October 2016: Tighter Qualification Rule
On October 17th, 2016, a new Government of Canada rule came into effect which made it harder for people with less than 20% down to qualify for a mortgage. This (large) group of buyers’ budgets has been significantly eroded. More can be read about this change
here.
Anecdotally, during the boom, I would often help typical buyer clients (e.g. new hires with Suncor and Syncrude) purchase homes in the $700,000 to $800,000 price range. Today, my buyer clients with a similar profile tend to purchase in the $400,000 to $600,000 price range, sometimes due to increased risk aversity and at other times due to their budget being limited by recent government policy, or both. Furthermore, this “typical buyer” of the past has been replaced somewhat by buyers with a different profile: People who work in town in secondary and tertiary industries (with lower incomes).
7) April 2017: First Rebuild Homes Listed in Significant Numbers.
This year, we have seen a slight uptick in demand (probably due to lower home prices), however in recent months, a supply of
newly rebuilt homes has also appeared. Overall the rebuilds have not yet had a game-changing impact on supply. Inventory is still very much in line with the 5-year average for this time of year, and the supply-demand imbalance is still caused by low demand.
It’s hard to write this piece non-emotionally because we all know so many families in difficult situations. But this post is what it is: A history of the correction so far. All A-Team agents are well-versed on the market, so please don’t hesitate to ask yours (buyer agent or listing agent) for advice on the state of the market today. I hope this article helps you!