Where Are the Homes?
It’s no secret that this year there are fewer homes for sale. What’s more is that a large fraction of the available inventory is distressed listings (specifically,
foreclosures).
So if you’re thinking about getting into the market, you may be growing a little concerned. If you’re thinking of listing your home for sale, this blog will have some really really helpful info for you, too.
Today I want to share a pretty cool chart, and use it to explain some of the thoughts I’ve been having. If this year is your year to buy or sell, I am hoping you will find some cool nuggets of info.
Buyers: Don’t Panic!
If you are a potential buyer, don’t panic.
It’s alright.
December & January are typically the lowest inventory months of the year, with this year being no exception. In fact, the most scarce day appears to have been Feb 1, and that, my friends, is a date in the past...
From February to June (at least), choice for buyers tends to increase.
A Dope Chart
I created this little beast to help because I was curious to see where all the new listings are so far this year. I mean, in which subdivisions…
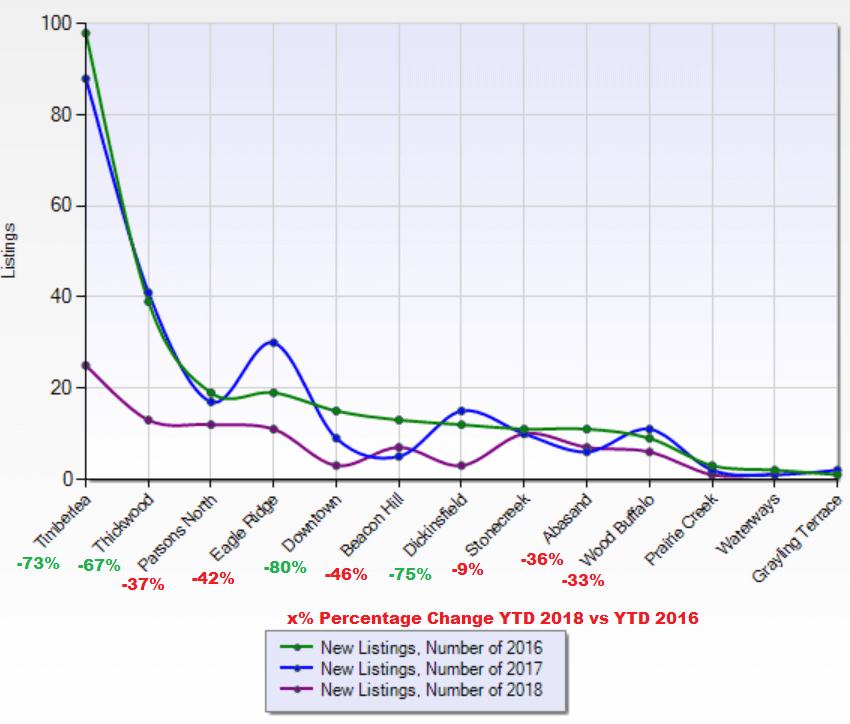
Number of New Listings YTD in The Last 4 Years, Grouped by Subdivision
Before we get started analysing this thing, let’s make a really important note: This graph only includes homes without condo fees (most commonly single-family homes and duplexes) and vacant lots have been excluded. I’ll write a follow-up blog soon with the equivalent chart for condos, and it’s super interestingly different, so feel free to follow us on social media so as not to miss it. If you can’t wait, please feel free to get in touch for personalized advice.
We can learn some things from the chart. Here goes...
1) New Listings Are Down (A Lot)
We blogged about this a few days ago, but it’s the first obvious conclusion. That is, the
rate of new listings coming onto the market this year is down as a response to lower prices. Depending on the neighbourhood, they are down between 9% and 80% compared to 2016 year-to-date (YTD). That’s right: There are no neighbourhoods where the rate of new listings has increased.
2) Fire-Impacted Neighbourhoods Are Where The Supply Is
New listings are still down in Beacon Hill, Abasand, Stonecreek and Wood Buffalo, but they are not down nearly as much as in most of the unaffected neighbourhoods. This could be for at least three reasons:
a) People have been waiting to be able to sell (deferred listings...i.e. People who would have listed last year, but couldn’t for obvious/sad reasons).
b) The fire has caused people to want to sell.
c) The fire has caused people to be able to sell. In some cases, victims of the fire have a more valuable (to the market) product today than their unaffected neighbours. Due to having a new home to sell, they may not be affected by negative equity in the same way, so can still afford to sell.
3) Parson’s Creek & Eagle Ridge Stand Out
Now, it is early days in 2018, but it appears that more people in these subdivisions are choosing to list, as compared to their Timberlea neighbours (for example). This is a bit perplexing because it might seem natural to assume that families with older homes would have more equity. It’s possible that the converse is true. Perhaps it is demographics, or more do to with socio-economics, but it appears that people in Eagle Ridge and Parson’s Creek remain either more motivated, or more able to sell their homes than people who own Timberlea homes. We shall see if this continues to play out during the rest of the year (those neighbourhoods could just be outliers at this early stage).
Possible Conclusions
One thing we’ve been advising
buyer clients is that if you don’t mind where you live, then it might make more sense (as the year goes on) to choose to live south of the bridge, in say Abasand or Beacon Hill. The reason is that most other people prefer to live north of the bridge, whereas, as you can already see from the chart, plenty of homes are coming online south of the bridge. If this was to continue, for some time, then logically, you might expect prices to differ significantly between north and south. In the last few years, there has been a
price differential, but you can imagine a world where it is bigger.
What about the "How" to find listings question? Well, you could have one of our specialist buyer's agents help you. In the meantime, please enjoy searching the whole MLS® here on our website. We are committed to not hassling visitors if you just want to browse!
If you are looking to sell a home with one of our listing agents, they’ll be careful to not just look at the price range, but also the location, when fine-tuning pricing for you. In a balanced market, their marketing abilities can be used to premium price certain homes. If your home is in Timberlea, Thickwood, Dickinsfield, etc., then that’s a good thing because you don’t have much competition yet this year, and there are plenty of buyers in those parts of town.
I hope you enjoy these blogs. We’ll be posting every day from now until March something, so be sure to check back or subscribe to the newsletter, if you like them. Thanks for reading and sharing!