A Look at the YMM Housing Market
2020 could be the year that home values stop falling.
They could even go up.
Things have been changing on the ground (tilting away from favouring buyers) in the two months since the federal election, but we wanted to wait until the new year before writing this article so we have more data/information for you. This article looks at the facts & figures so you can decide for yourself what you think will happen in 2020.
For sure, this article will be helpful for people thinking about when to buy their first home, move into a new home, or purchase an investment property, however…
...Given how brutal the last 5 years have been for homeowners, if you own a home in Fort McMurray, then really this article is for you.
This article looks at:
- Refresher: Why Have Home Values Fallen So Much?
- The Big News: Important Market Changes Since November
- Should Sellers Worry About Foreclosures?
- Conclusion: Thoughts for Sellers & Buyers
Refresher: Why Have Home Values Fallen So Much?
The average homeowner has lost about $250,000 of the value of their home since the peak (for example, the 6 agents on our team have lost about $2.3Million in the values of our properties over that time period).
Here are the primary causes:
- World oil price collapse
- Local oil price collapse (pipelines at capacity)
- Population decrease due to wildfire
- Stress tests (round 1)
- Stress tests (round 2)
- Increasing condo insurance costs
Due to factors 1), 2) & 3), rents have collapsed by 40-50% (remember when
townhomes/
mobiles used to rent for $3,600 a month, homes for $5,000,
apartments/basements for $2,600?). Due to 4), 5) and more recently 6), the cost of owning a fixed amount of properties has increased (buyer power decreased).
This table shows the reduction in demand between the first and second halves of the 2010s:
Table 1: Fort McMurray Home Sales
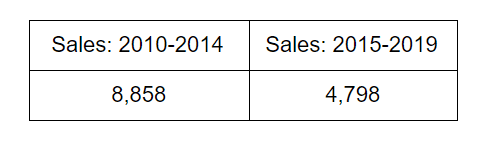
That is, the total number of sales was down 44% in the last 5 years as compared to the 5 years before then.
To put that figure in perspective, that’s about as big as a correction gets. For example, check out this equivalent table for Phoenix (metro area), Arizona: one of the worst-hit cities in the US in the 2008 housing crash:
Table 2: Phoenix Home Sales
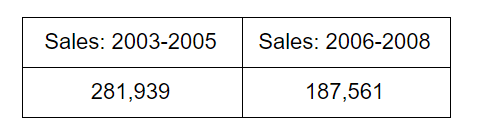
Not only did the recovery in Phoenix sales begin sharply after only 3 years in 2009, but the percentage decrease in sales the crash (34%) was smaller than what we have seen in Fort McMurray.
Clearly, we know exactly why prices have fallen so significantly.
:
The economy...
...demand.
The Big News: Important Market Changes Since November
2019 turned out to be worse than we had expected for homeowners and we think it’s because of the federal election. Look, for example, at sales:
Chart 1: Monthly Home Sales in 2019 vs 2018:
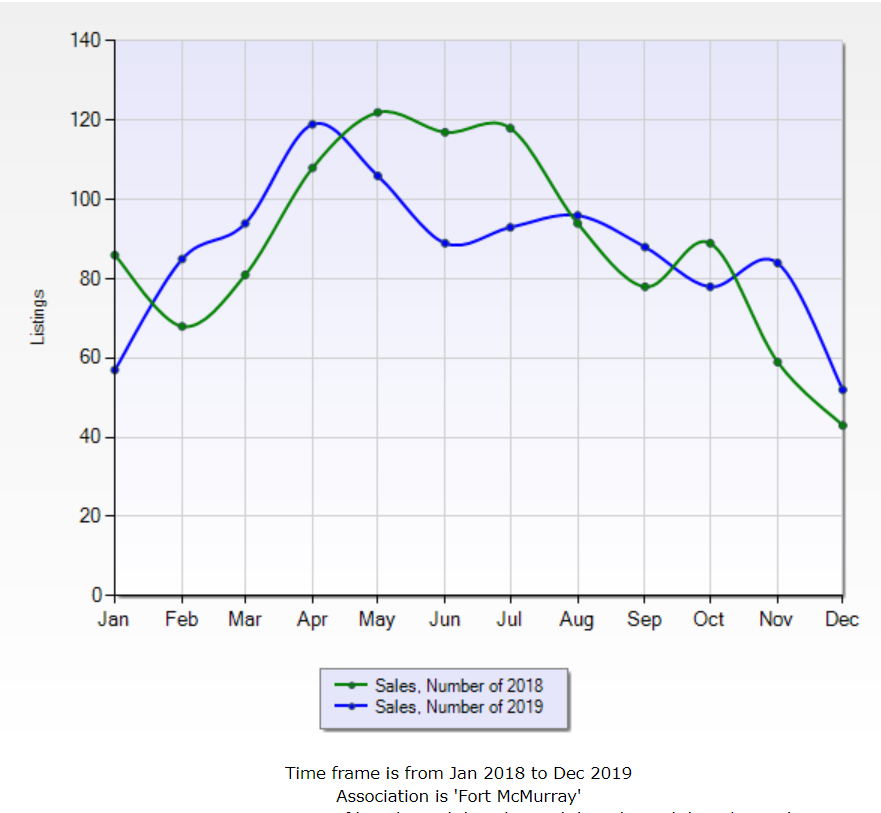
The year started well, but the summer especially, was relatively slow. Since the election, sales have been up year-over-year as confidence has returned. Uncertainty is a strange concept. You might think that people would prefer the “good” outcome, then uncertainty, then the “bad” outcome (in that order), but what we have found is that people prefer the “good” outcome, then the “bad” outcome, then uncertainty.
It appears that people were delaying their purchases over the summer as if they might choose not to buy at all in the event of the “bad” outcome, but when the “bad” outcome happened, they bought anyway.
Chart 2: Monthly Listing Expired 2019 vs 2018
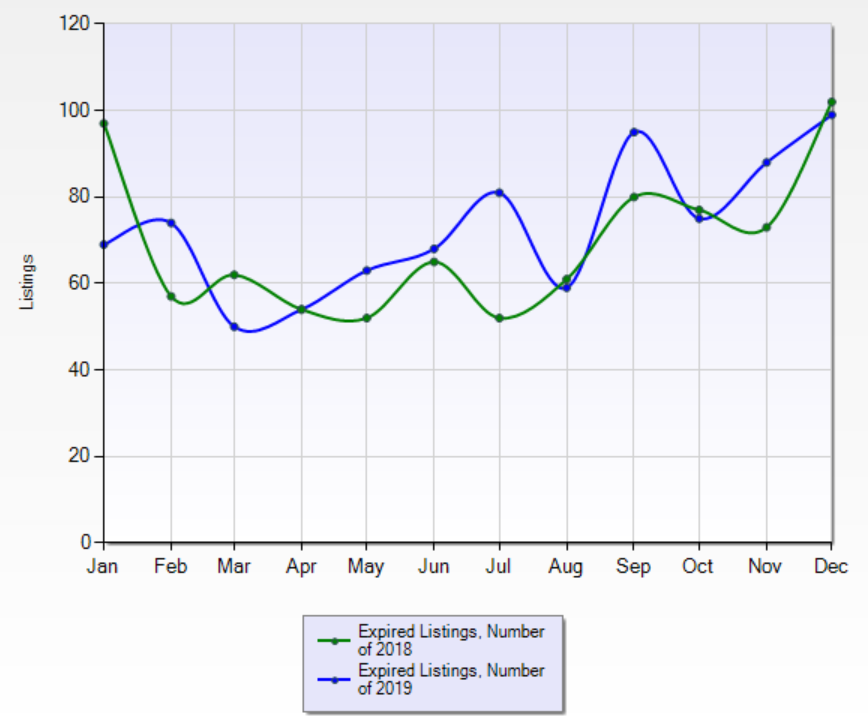
You can see in the above chart that the number of expired listings was greater in the last 6 months of 2019 vs the previous year, including after the election. Sellers have been reacting to lower prices. They have been taking their homes off the market at a faster rate.
Chart 3: New Listings over 2019 vs 2018
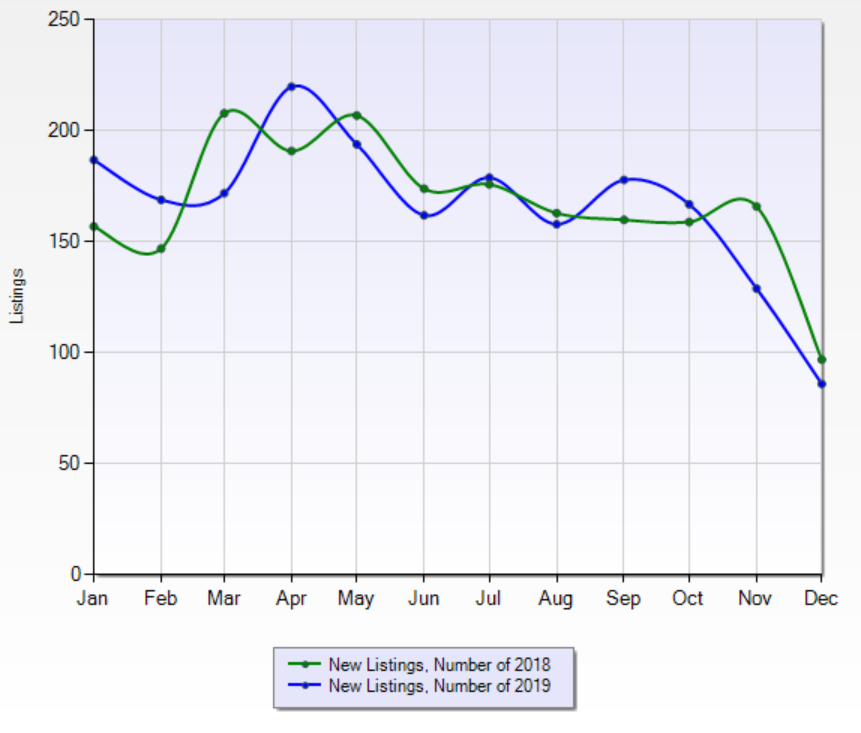
Chart 3 shows that the relative rate of new listings has decreased since the election (vis-a-vis 2018). We think this is partly due to certainty, and partly due to prices being so low now that for most people, it just doesn’t make sense to sell. The advice we are giving many sellers, for example, is changing (see later).
All of this leads to the big one...
The following chart is the reason that I am writing this article:
Chart 4: The Stock of Inventory over 2019 vs 2018
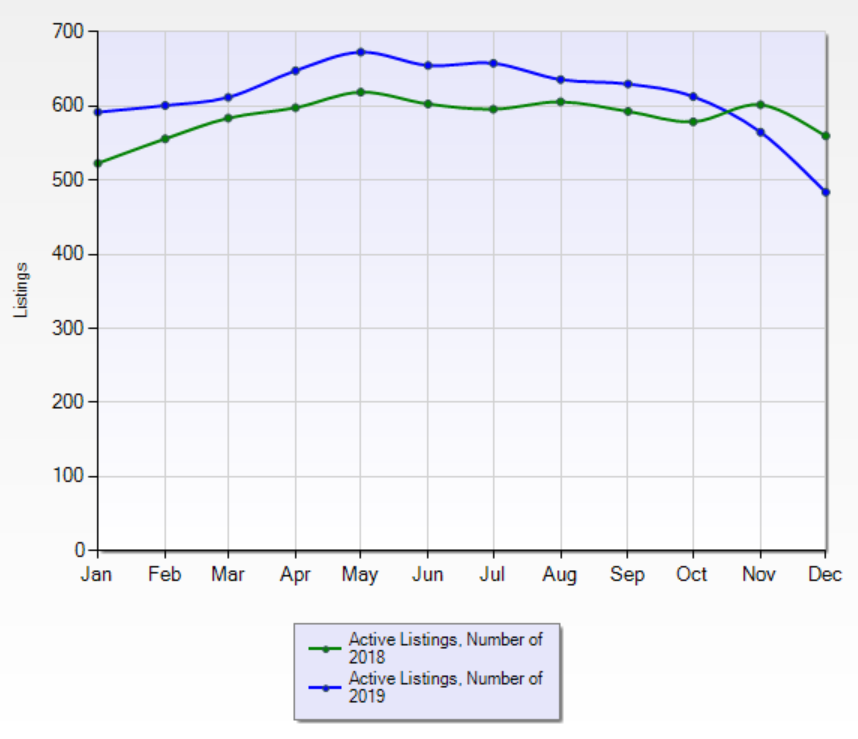
If you are a homeowner, you will be relieved to see that the number of homes on the market is down significantly since the federal election. By the end of 2019, housing inventory sat 12% lower than it did at the end of 2018. To put this in perspective, the number of homes on the market in our research area peaked at 998 in September 2015 (96% higher). Even in December of 2014, it stood at 780.
Lower prices, a change in government in Alberta, as well as a more certain future in federal politics, have led to a relative increase in sales in the last two months as compared to the same two months in 2018. Probably more importantly, however, those factors have led to a change in the seller mindset: Sellers are increasingly choosing to hold instead of sell, which, taken on its own, is theoretically positive for prices.
Should Sellers Worry About Foreclosures?
You may have read recent news articles about the increasing number of homes that went into
foreclosure in our area last year. Our RE/MAXⓇ broker, Katie Ekroth, appeared on Mix103.7FM to discuss it, and you can read the
summary here.
It’s absolutely the case that foreclosure rates (and the stock of inventory) increased in 2019:
Chart 5: Inventory of Fort McMurray Foreclosures, 2015-2019
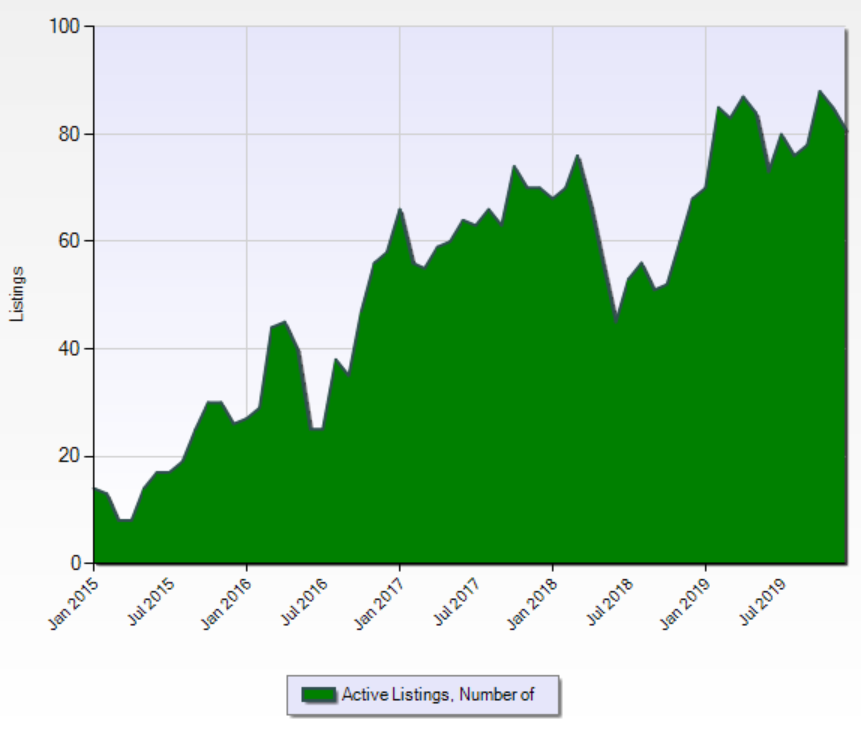
It’s not really news, as it’s something we’ve tracked for a long time, but when our clients ask us about the increased foreclosure rate, they are understandably emotional about it - either really worried or deciding that they’d like to buy now.
Check out this chart from David Meet’s blog (a REALTORⓇ in Phoenix):
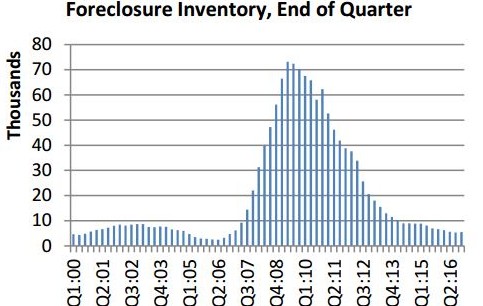
The chart shows the inventory of foreclosure listings during the US housing crisis. Recall that total sales recovered substantially in 2009. However, the number of distressed listings on the market also peaked at around that time. It makes sense that as confidence returns to a market place, sales increase, prices stabilize (or go up) and the number of foreclosures on the market peaks then falls.
That appears to be where we are at.
In balanced markets, typically the foreclosure rate is low and the average seller in the market tolerates a 50% chance of selling. That is, if there are two sellers on a street, one of them sells, and one of them lets their listing expire. There is one buyer walking down the street, therefore prices don’t rise or fall. In a market with lots of foreclosures, this 2:1 ratio tends to break down a bit, because there is only one buyer, but if both are foreclosures, the sums don’t add up, and those determined sellers compete for that buyer.
Today, we only have 437 listings on the market in total. If there were no foreclosures on the market, that probably wouldn’t be enough to stop prices from rising in our market, if elevated sales trends were to continue. Because foreclosures tend to stick around until they sell, it may take a little longer than we might otherwise expect to reach to a shortage position in the market...
But all markets balance eventually, and ours appears to be balancing right about now.
We’ll keep a close eye on things, so if you are reading this later in 2020, check out our more recent articles & vlogs.
In summary: We think sellers should try to not worry too much about foreclosures.The higher foreclosure levels are existing within a world of far fewer non-foreclosure listings.
That is, of course, unless you are planning to list your home and compete with a foreclosure...
If so, the best thing you can do is present your home beautifully, with professional photos, best quality video, web, Facebook, YouTube, etc. If your agent does this right, we can sell your home now for a premium by getting it a TON of foot traffic. We’ve even reduced our commissions this year, so please let us know if you’d like help selling for top dollar.
Conclusion: Thoughts for Buyers & Sellers
In the past, we posted this article about
signs to look for in a balancing market, and it includes this handy model:
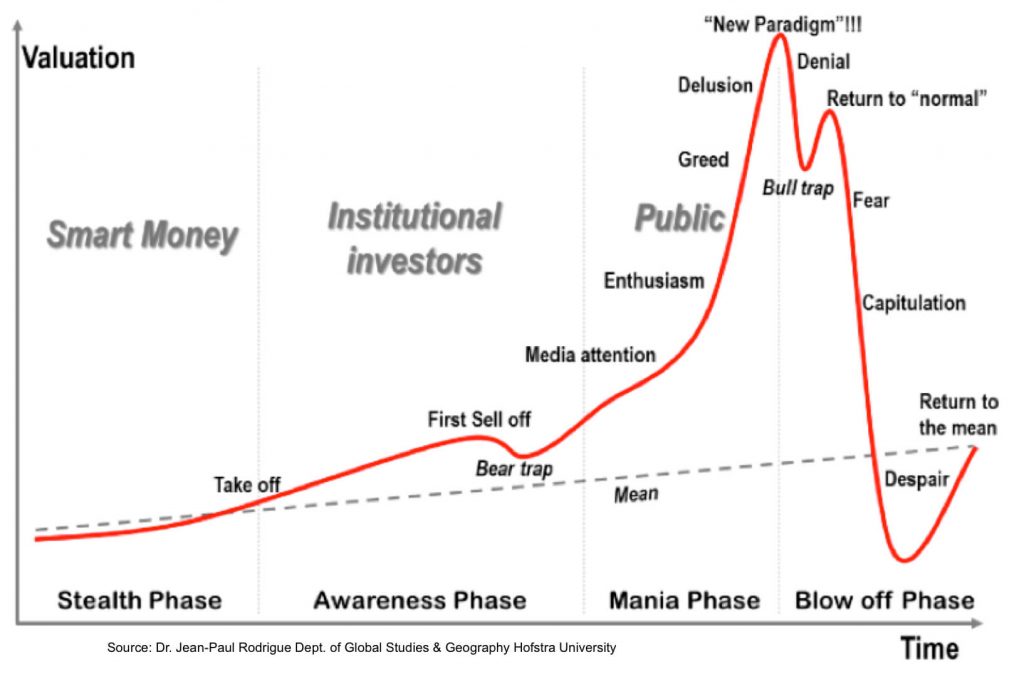
How have you felt about the housing market since 2014? Do you recognize some of the emotions in the chart? We do, and we try to keep things as cool and methodical as possible.
Our message in 2015 was: “Don’t be in denial”
Our message for this moment in time is: “Don’t despair”
Sellers: With property values having fallen so much, you can see why we have begun advising sellers to consider the option of holding as well (unless people who come to us have serious motivations to sell, e.g. bereavement, retirement, financial, relocation, marital). If you’d like to know the current value of your home, it might not be pretty, but with us, you can guarantee that it will be accurate. Also, as noted above, it’s deeply related to quality in this market which is a wash with foreclosures, so we can advise on improvements to make while you wait. We have specialist listing agents here when you need us (all they do is sell homes) and they love giving second opinions of value. In a balanced/seller’s market, we recognize that the race to the bottom is over, and we’ll squeeze every drop of value out of your home that we can. Check out our seller page & reach out to us for more information. Of course, our advice all depends on what you have!
Buyers: We don’t know the future, but if you choose to assume a balanced market from here on in, then you can expect a bit more choice in the spring (and a lot more competing buyers). There’s not much for listings right now, unless you don’t mind getting your hands a bit dirty, in which case there’s a big argument to go before spring. For personalized advice, we have specialist buyer’s agents here to help. Buying decisions are so personal (especially when to buy), so there’s a lot to talk about. Schedule a consultation now if you’d like quality advice tailored to you and your family. Of course, our advice all depends what you’re thinking of buying!
Thanks for reading!