The Future of Fort McMurray Real Estate
Most residents of Fort McMurray have a significant interest the local real estate market, either as owners, landlords, or tenants.
It’s a crazy market.
And we all know that prices and rents have taken serious falls over the last three years. It has not been at all easy for owners and landlords, but people buying and renting have enjoyed an easier time than during the boom years.
What you may not know is that in recent weeks, our real estate market has become decidedly less negative. So, with the new year fast approaching, it’s a good time for an update.
I really hope you enjoy this article and find it useful in your daily life!
In July of this year, I offered a full history of the real estate correction, then in September, I wrote about 8 signs of recovery to watch for. You might also want to refer to the November article entitled “The Effect of Oil Prices, Interest Rates and Employment on the Fort McMurray Housing Market”. Some of these articles are recommended reading, and will be linked to throughout today's post.
Here’s the plan for today:
Part 1: Give a market update on what has happened since the July article
Part 2: Evaluate the 8 signs of recovery. Have we seen evidence of them?
Part 3: I will share some thoughts and themes for 2018, without, of course, making any predictions.
In this way, we'll be able to draw a line under 2017 together and look ahead to the future.
Part 1: Market Update - The Last 6 Months of Data
Here is a graph of prices over time
:
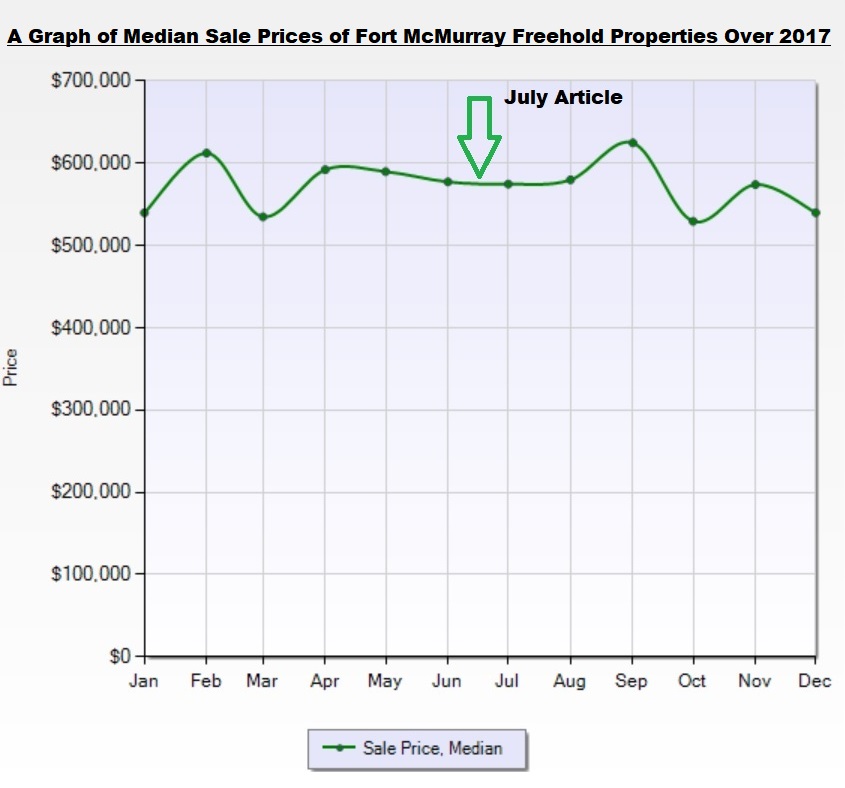
As you can see, since the last time we took an in-depth look at the market, median sale prices have continued to fall. Prices have fallen approximately 1-1.5% a month over the last 6 months. We remain in a buyer’s market.
In the July article, I added important events to the chart and explained how some of them may impact prices.
This time, there aren’t enough data-points to add on because the last 6 months has not been so much about events as it has been about trends.
General trends have been an improvement in the oil market, and a return to growth in Alberta. Happily, rebuilds are being completed at a steady rate. However, these have not shocked the market with large volumes of new supply. Another trend is that the rate of foreclosures coming onto the market has risen, but again, the market has not become more swamped. Over the last six months, we have seen fewer homes being listed for sale vis a vis the same period in 2015, 2016, and in the last 3 months, sales have increased slightly, year on year. We will explore these trends with a couple of charts, but for now, let’s just look at the one event that is slated to have effects Canada-wide:
Tighter Mortgage Rules & Rising Interest Rates
It had been circulated unofficially for months, but in
October, the Federal Government announced a new policy that effectively lowers the pre-approvals of homebuyers with large down payments (20% down or more):
OSFI sets new mortgage rules, including stress test for uninsured borrowers
Among the major new rules is a requirement to stress test uninsured borrowers. Previously, only insured borrowers had to undergo such a test.
By law, borrowers with a down payment of under 20 per cent for a home must purchase mortgage insurance. Borrowers pay an insurance premium, but the beneficiary is actually the lender, because the insurance protects the loan giver in the event the borrower defaults on the loan. Via www.cbc.ca
This policy, which is due to come into effect
January 1, 2018, is extremely similar to the rules that came into effect in
February of this year, only it applies to those remaining buyers with higher down-payments. As noted in the July article, however, as a team, we have a lot of anecdotal evidence that even today, most home
buyers in our marketplace (whether first, second or even third-time home buyers), tend to make purchases with less than 20% down. I’ll leave it up to the reader to determine, therefore, whether demand in our market will really be affected much.
Over the last 6 months, the Bank of Canada has increased interest rates in an attempt to control home prices in Toronto and Vancouver. Most banks give 90-day or 120-day pre-approvals however, so in practical terms, these increases are only coming into effect for people right about now. We know that some people have been searching with more urgency (and buying) this fall and winter in order to avoid paying a higher rate in say, February. Longer term impacts are explored in our November article.
Supply Is Down
There has been more demand in the last few weeks of 2017, but demand does vary greatly over time, and at this early stage, it is might not be wise to attribute this to a recovery (will it be sustained?). It could be, for example, in large part due to the new mortgage rules, or higher rates as described above.
But there is one story that is almost certainly significant. It’s the story of supply...
Here is a chart which shows inventory over the last four years:
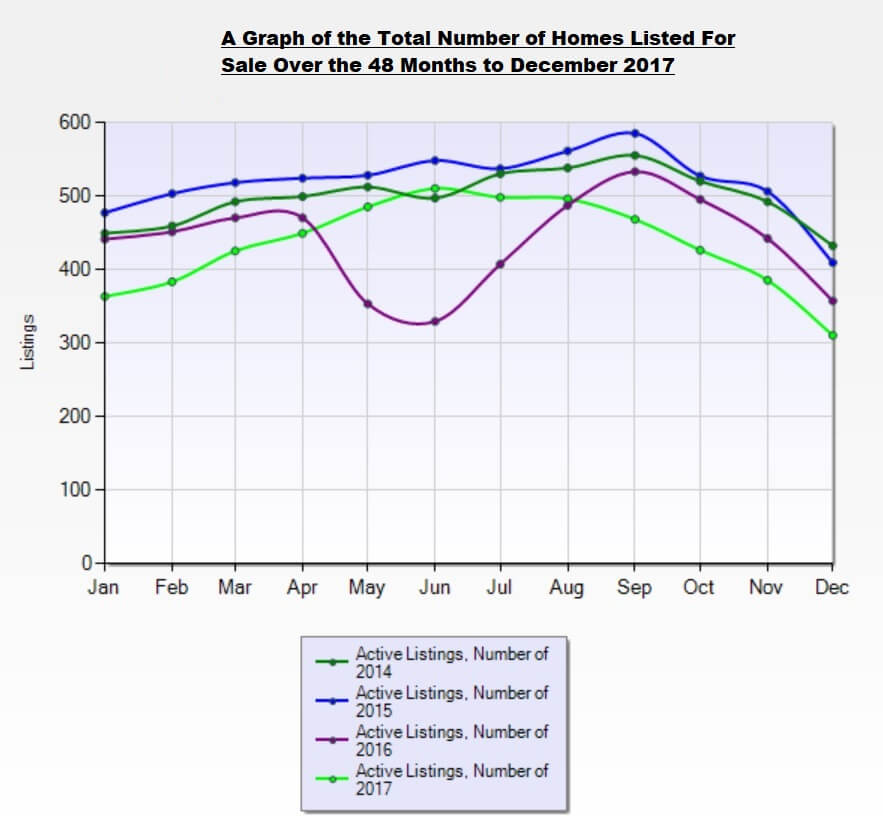
Check out the point in June, where the two green lines intersect: This was the high point of supply in 2017. In all the other previous years (2014, 2015, 2016), that high point did not occur until September. Since June, inventory has fallen steadily, to the point where today, it is approximately 20% lower than the five-year average.
This could be a really important development because in late 2014, monthly sales took a 50% hit, and so far their recovery has been anemic. For prices to stop falling, we either need consistently higher sales or less inventory. So...
What has been happening?
The thing to know is that inventory at any given time is the result of a formula:
Inventory (THIS MONTH) = Inventory (LAST MONTH) + New Listings - Expireds - Sales
I’ve been studying each element of the right-hand side of the formula, and the answer, in a nutshell, is that new listings have been coming on at a significantly slower pace in Q3 and Q4 of this year.
Summary for Part 1
We still have an imbalance, so prices are still falling: however, the ratio of sales to inventory is not as much out of whack as it was in 2015, 2016 and the first half of 2017.
Foreclosures are up, and rebuilds are coming onto the market, but as they are listed, they take the place of regular resale homes (not adding to them) as potential sellers in the resale market are choosing not to list due to lower prices.
All markets eventually balance, and we are finally seeing signs in the data (particularly on the inventory side) that balanced prices are less distant in the future than they once were.
Part 2: Recovery? Evaluating the Anecdotal Evidence
In September, I outlined
some signs of recovery that readers could watch for.
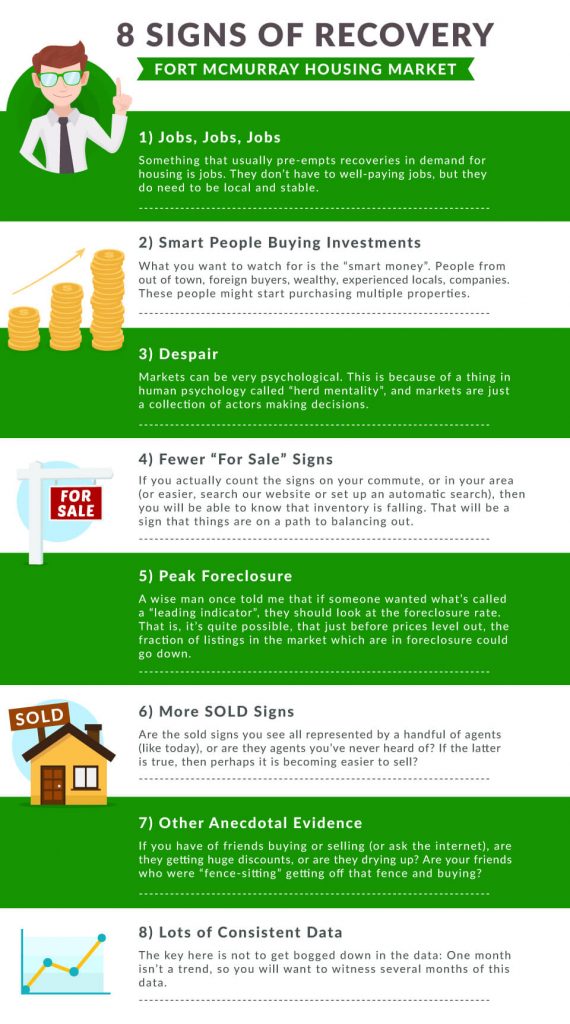
Let’s look at these individually & I’ll share my experience. You can keep judging using your knowledge:
1) Jobs
I hear of layoffs, but unlike in the past. I do hear of new local jobs, at site as well as in town. As retail/commercial rents have fallen, the service sector seems to be growing. New businesses in town, even small ones, which create jobs, and those jobs could eventually generate housing demand, especially in the lower price ranges. What are your thoughts?
2) Investors
In the last 6 months or so, our team has started to see investors again for the first time in a few years. They are not coming to us in large volumes, but it does look a little bit like green shoots. There are, of course, accidental landlords, too: People who need a larger home, and due to some newfound confidence, they are happier than they were in the past to buy that home, and keep, for example, their
mobile/apartment as a rental.
3) Despair
It’s really tough out there, but I think the mood of the town seems to have swung back towards resilience. If it keeps up, that’s a positive sign for recovery.
4) Fewer “For Sale” Signs
See above. We have statistical evidence of this, which is way better than anecdotal evidence.
5) Peak Foreclosure
Privately, we track the number of foreclosures on the market, and it is extremely difficult to estimate, so we’re not comfortable sharing the data here. It’s further complicated because inventory changes seasonally. Our assessment is that while the number on the market appears to have stopped increasing in the last few weeks, it is too early to tell whether or not this is the peak.
6) More “SOLD” Signs
Our RE/MAX Fort McMurray broker, Lance Bussieres, noted
in this CBC article that sales are up slightly this year:
"As of Nov. 30, more than 909 residences were sold in Fort McMurray," Bussieres said. That's up from the 800 sold in 2016, and is closing in on the 932 dwellings sold in 2015.
7) Other Anecdotal Evidence
Some confidence appears to be returning and this has shown up in the behaviours of buyers. There is less choice in the market, which makes buyers a little jumpier to offer. Upon first meeting buyer clients, there is less nervousness about the future, as there once was. By and large, negotiations are still favouring the buyer.
8) Lots of Consistent Data
Other than inventory (see part 1, above), it is too soon to call major changes.
Part 3: The Real Estate Market in 2018
A previous article in this series explored a few themes for things that might impact our local housing market in 2018, from employment to interest rates.
Hopefully, today’s post has given you a good sense of what is going on.
Here’s are some further thoughts as we cross the threshold of the new year:
- We are still in a buyer’s market, with prices falling and negotiations, still, largely favouring buyers.
- Choice in the market is down, in part for seasonal reasons, but also due to consistently fewer new listings coming online (despite foreclosures and the rebuild). In some parts of the market, quality inventory is harder to find than it once was.
- The Canadian housing market continues to be more heavily regulated, and home ownership is becoming more expensive locally, too.
- The Alberta economy is improving, as well as, arguably the local Fort McMurray economy. New jobs are being produced.
- There is a significant supply of residential lots in rebuild areas, the vast majority of which are not currently listed on the MLS® (large shadow inventory).
- We don’t know many people who are anticipating growth in prices.
- We are aware of quite a lot of potential sellers with homes to sell who would list their homes if prices were even marginally higher. We also sense that buyer clients would be very sensitive to that also in that the sales volumes would not increase, in the absence of a significant improvement of the economic fundamentals.
- Most people are still purchasing in the lower price ranges and entry-level housing types, but this might be starting to change (too early to tell).
We don’t know the future (we can’t). Many wise people believe strongly that the cyclical nature of the town will continue long into the future. For others, the slogan adopted by the Regional Municipality of Wood Buffalo seems to accurately describe the future:
A Balanced Future with Opportunity For All (?)
We will keep a close watch on developments because the answer will be revealed over time, as we monitor existing trends and identify new ones. We’ll share them here as we go, and if the last three years are anything to go by, it’s sure to be eventful!
Everyone at The A-Team wishes you and yours all the best in 2018, and we’re here if you need us: We pride ourselves on guiding every client with clear, unbiased information, and advice that is completely in your best interests.
If you’d like to meet us, we’d like that too, so please reach out. Thank you sincerely for reading; please feel free to share with friends & family. :)