After what we’ve been through, few questions matter more to Fort McMurray residents.
When we were evacuated, we posted this to our Facebook page:
But we knew the economic recovery would take a lot longer. Both from the fire, mortgage rule changes, and the sudden shift in the global oil market.
The period 2014-2016 was shocking for our community, both emotionally and economically. During that time, several exogenous shocks occurred and home buyers’ reactions were to turn away from purchasing homes, to delay, and to reduce budgets/goals.
Are Prices Stabilizing?
If you’ve followed our blog for a while, you’ll recall we wrote an
article asking a similar question this time last year and the answer we came up with (after some analysis) was basically “no”, or “not yet”.
Encouragingly, today we’ll have a different answer for you.
Let’s start by identifying the initial effects of these shocks, before moving on to see what has happened since...
Economic Shock (2014-2016)
Written in 2017,
this article gives a full explanation of the forces that shook us around during the shock.
Now that we have the benefit of hindsight, let’s take a deeper look at the immediate effect that shock had on home buyers in our marketplace. Let’s start with Econ 101
In theory, we are taught that shocks to families’ finances can play out in two ways:
1.) Income Effect
2.) Substitution Effect
The Income Effect: Essentially, if our budget is lower, we will buy fewer of something. For example, families may choose to purchase fewer Mars chocolate bars. In terms of housing, maybe we buy fewer homes (in other words, fewer families choose to purchase). Instead, we may remain tenants as mortgage rules prevent us from getting what we want, or decreased job security prevents us from wanting to make financial commitments.
Chart 1:
Chart 1: Residential Sales in Fort McMurray 2009-2019 (YTD)
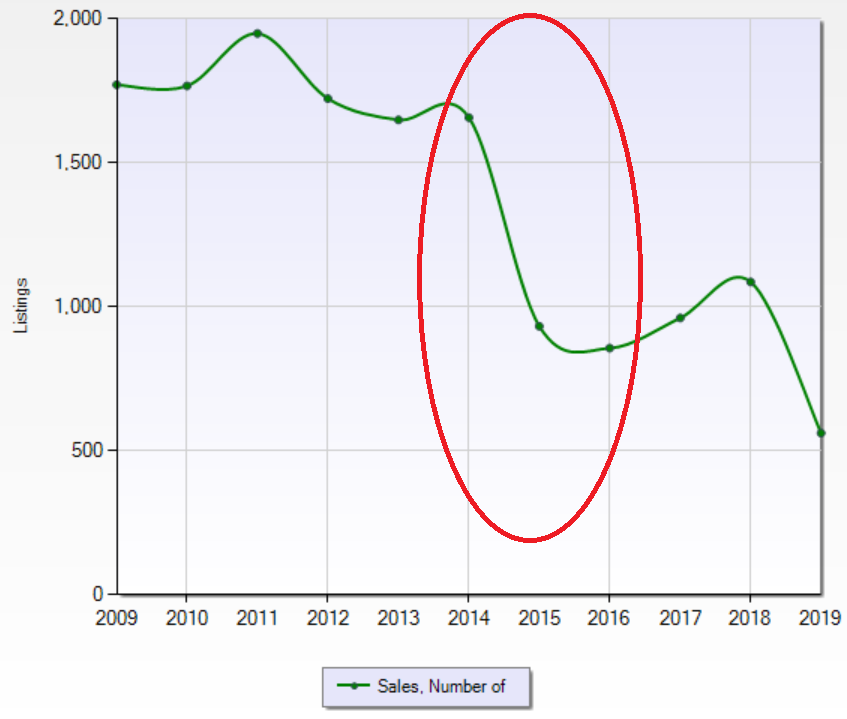
We can see that the shock to demand was immediate and large (about 50%), and that since the time of the shock, there has been only a modest recovery in demand. As noted in recent articles, this is likely due to prices being lower (which, as opposed to the initial shock, actually increases purchasing power).
The Substitution Effect: If we have tighter income constraint, sometimes we choose to substitute away from luxury goods, and into basic goods. For example, from Mars chocolate bars to bread. Or from luxury homes to ones that satisfy just our needs, not our needs and our wants.
Chart 2 shows the substitution and income effect on our local housing market during the time period:
Chart 2: Histogram of Residential Sales in Fort McMurray 2014-2016 (YTD)
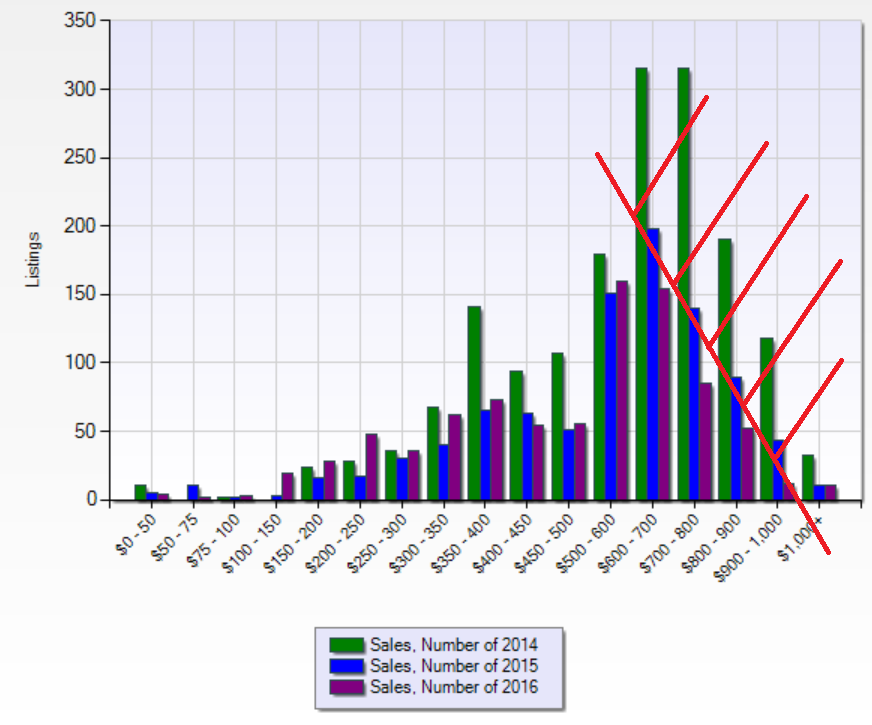
The histogram shows the rapidly changing volume of transactions in the different price brackets. The main area of lost transactions over the period occurred in the higher price ranges (the section that we have redded out). To boot, the loss of confidence didn’t really take effect until 2016 - most of the change occurred 2014 to 2015, presumably as a result of the oil bust. We think this is an important insight. Yes, other things have impacted our market, but the sudden cessation of oil sands development seems to have had the most significant impact on local housing demand. This might be important when we think about drivers for recovery.
We haven’t marked it on the chart, but there are also some bars between $300k and $500k that reduced greatly during this period. This reflects reduced transactions for properties with condo fees that had really nice features. The substitution away from higher-end properties occurred both in the market for homes with and without condo fees. Both are shown on the above chart.
Above all, the most important mental note to take from these two charts is that the oil shock of late 2014 appears to be the main driver. It destroyed demand rapidly, and mainly in the higher priced parts of markets of all property types. As people’s incomes, employment and expectations changed almost overnight, so did their budgets and goals.
The rest of this article looks at what has happened since...
Adjustment Period (2017-2019)
It is strange to say it, but since the time of the shock, the pattern of demand really hasn’t changed significantly: Peoples’ budgets today are very similar to what they were at the end of 2016:
Check out chart 3 to see what I mean:
Chart 3: Histogram of Residential Sales in Fort McMurray 2017 (YTD)-2019 (YTD)
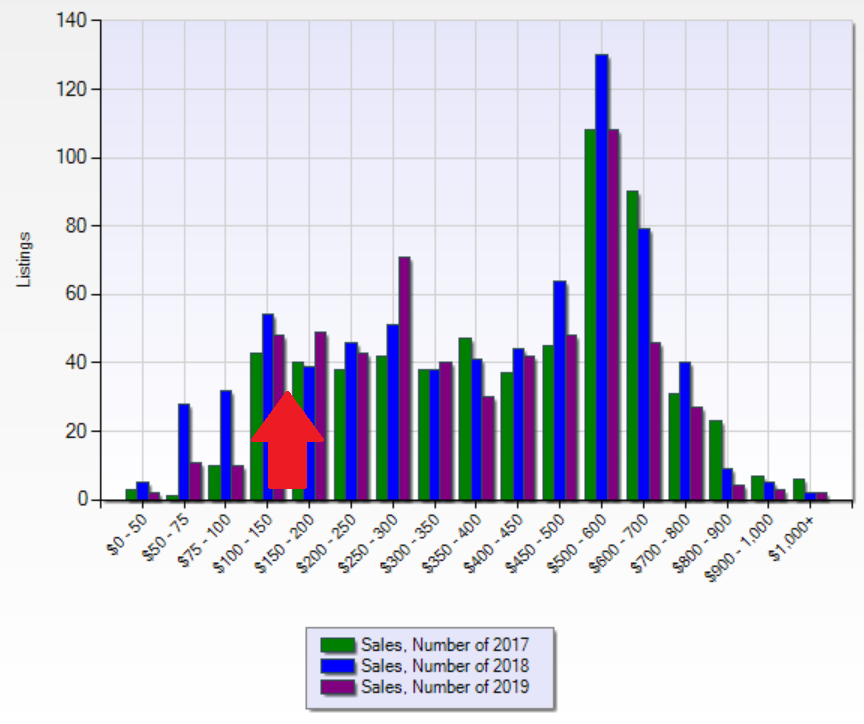
To start, please ignore the red arrow.
The thing that surprised me the most when I pulled up this chart, was that nothing huge changed between 2016 and 2019 regarding the shape of demand. The most common purchase price range in 2016 was $550,000 to $600,000, and guess what? That’s still the case today!
In summary: Since the period of shocks, most peoples’ budgets haven’t changed.
Back to the red arrow….
One significant change is that during the period since the fire, there has been an increase in demand for low price properties. The reason being, presumably, is that before late 2016, there was almost nothing available for sale below $300,000. As condo prices changed rapidly, and vacant lots became available for the first time at competitive prices, it was almost like a new market opened up. The missing demand in the very high price ranges is slowly appearing in the very low price ranges as time goes on.
Another is that the demand for high-end homes has indeed continued to dwindle during the adjustment period. Homeowners of those homes are now facing the biggest losses vis-a-vis the boom.
Hope?
Is this a story of hope for today’s homeowners? I think it is.
It’s been a terrible time for Fort McMurray homeowners in all price ranges: In our blog “How Much Have Fort McMurray Home Values Fallen?” we lay it all out (for those who can stomach it), and basically we find that values have fallen not so much in percentage terms as in dollar terms. Properties that have lost less value are ones that are more simple (less luxurious). Properties that offer the highest standards of living (whether with or without condo fees) have fared less well.
What has been happening over the adjustment period is that values have been falling to match the new demand picture that formed over the shock period. There is evidence to show those falls are at, or close to, an end for different property types. For example, this panel of charts shows the median selling prices of some different property types. Note that average selling prices appear to be leveling out for many property types:
Chart 4: Panel of Charts Showing Median Selling Prices of Different Property Types Over 2009-2019
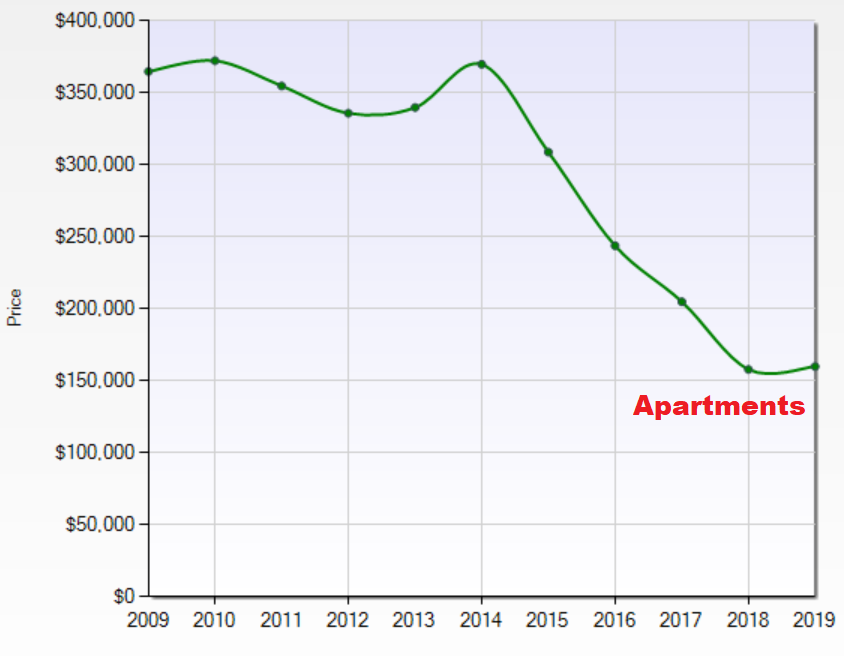
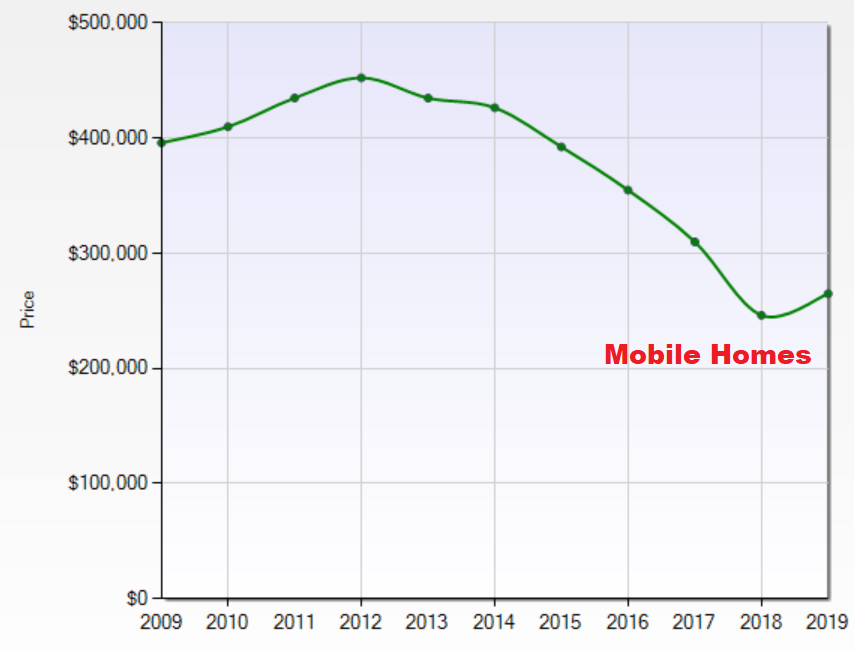
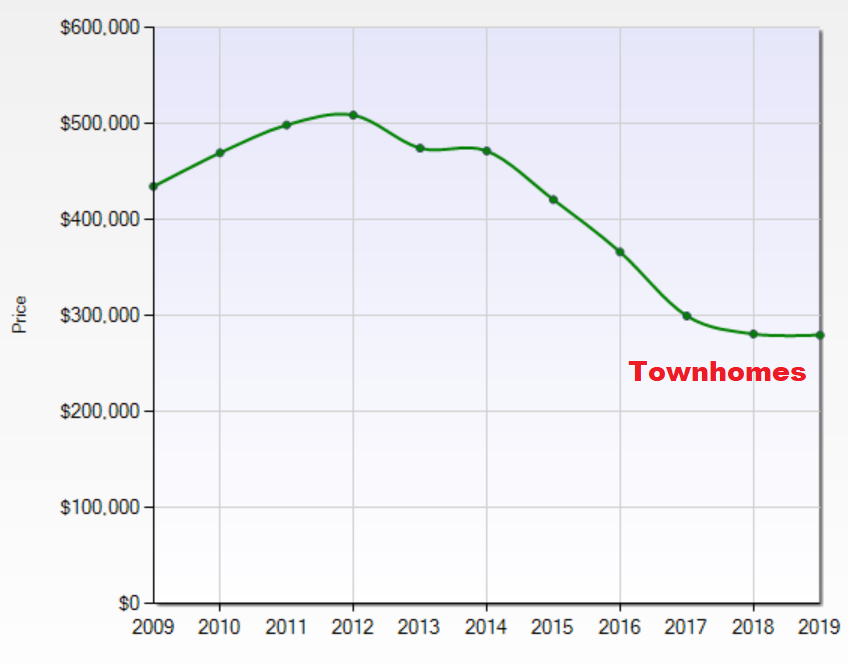
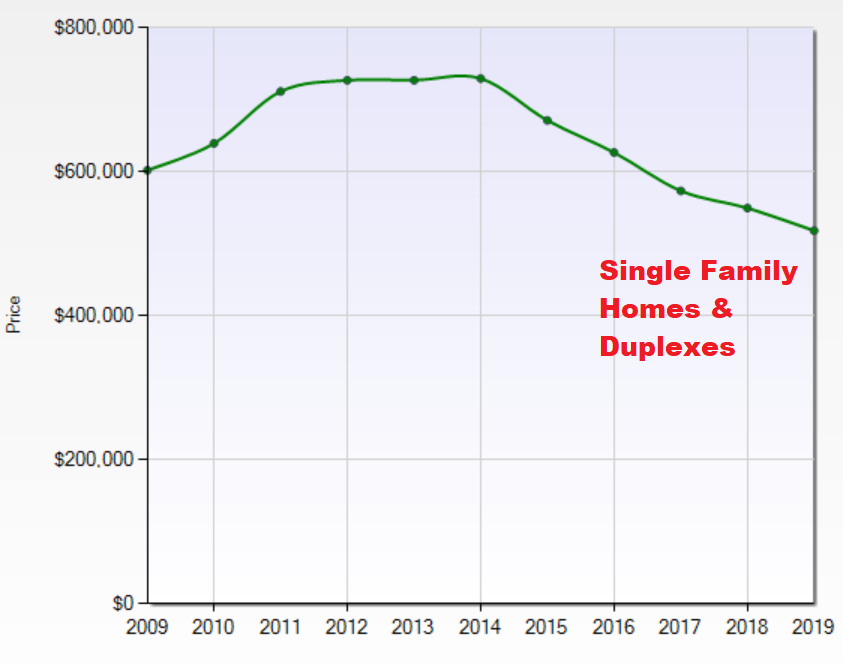
Some of this is playing out anecdotally, too. For example, when you look at values of studio apartments in The Peaks/Summits of Eagle Ridge, they are selling in a tight range $130,000 to $145,000 and they have been over the last 12 months.
Cautionary Notes
Firstly, we have to be careful before drawing the really serious conclusion that prices are no longer falling. For example, this years’ sales includes different housing stock from last years, especially with respect to the rebuild: Sales of
new properties can’t be compared to sales of older ones (apples to oranges). And, we do know that some of the
townhome,
apartment and
mobile sales are rebuilds.
Secondly, the market for homes without condo fees is a large market, and it’s really two markets in one. If you watch our monthly VLOGs, you’ll know that we still don’t have demand in the higher price ranges, and sellers in those price ranges are still aggressively cutting prices which cascades down into the lower price ranges. There is lots of demand up to $600,000, but prices are probably still eroding slightly due to this effect.
Thirdly, if prices are stabilizing, how come when we go to price people’s homes now compared to 6 months ago, we are coming out with lower prices for most property types and price ranges? The anecdotal evidence doesn’t quite match the charts.
Finally (and related), similar numbers of properties are changing hands in the various price ranges as before, but that does not mean values of individual properties are not falling. For example, in 2016 the $550,000 to $600,000 price range was similarly busy as it is today, but that budget today affords a buyer a lot more house than it did at that time. Even when the median selling price of different property types is stable, benchmark prices may still be falling, and we have no way of systematically tracking those - just anecdotal evidence.
Conclusion
The shock here was all about
oil. Demand reduced quickly and substituted into non-luxury property purchases. Since that time, there has been a modest recovery in demand, and a remarkably consistent shape of demand (people haven’t continued to shy further away, or come back to the table with big budgets).
As home values have fallen, the scope for them to fall further has lessened.
I was surprised this weekend when I went shopping in the $500,000 to $650,000 price range. The range of goods available went from entry-level (needing work) to genuinely exciting properties - large, fully developed homes, with huge lots, great locations, triple garages, etc.
Adjustment in the higher price ranges is still ongoing, and as it adjusts, the incentive to “move up” amongst our clients is growing.
As the adjustment process at the top continues, the incentive for buyers to push the boat out and get something really special is greater than it once was. Consequently (?), in June, there were a whole bunch of transactions in the $700,000’s for once. Could it be? Could it be…
The return of confidence?
If you are thinking of moving up, down, away or into your first home, and you value our data-driven approach and free information, please feel free to reach out so we can help you: Our specialists listing and buyer’s agents are ready to get you information specific to your situation.
Thank you for reading and supporting!